
Customer Experience (CX)
Customer Experience is the sum of every perception a customer forms across the lifecycle — from the first ad they see to the support call that saves (or loses) the relationship. Checkealos gives CX leaders a unified toolkit across 6 methodologies and 85 solutions, so signal from surveys, interviews, journeys, and support finally speaks the same language.
Enterprises that run continuous CX programs see higher retention, stronger NPS, and a measurable lift in revenue per customer — because experience, not price, is the most defensible competitive moat.
Problems Customer Experience Solves
Every team thinks they know why users churn, drop off, or don't adopt. UX research replaces the guesswork with evidence — and ties it straight to revenue.
Customer churn is diagnosed after the fact, when the relationship is already lost
NPS and CSAT sit in dashboards nobody acts on, disconnected from operational fixes
Journey pain points are visible in hindsight, not before the customer leaves
Voice of Customer is scattered across surveys, support tickets, and social with no synthesis
Support operations optimize for cost instead of customer effort and recovery
Marketing, sales, and service each own a slice of the journey with no shared truth
The 6 CX research methodologies
6 complementary methods to operationalize Customer Experience — from qualitative discovery to quantitative measurement.
Customer Journey & Touchpoint Strategy
30+ solutionsMap and optimize every touchpoint so the experience is intentional, not accidental, at each step of the lifecycle.
Visualize the end-to-end journey and expose the moments that quietly erode loyalty.
More →Tune each interaction so it delivers value instead of friction.
More →Pinpoint where customers hesitate, stall, or leave across the lifecycle.
More →Design first-value paths that turn new customers into retained ones.
More →Make the experience coherent whether on web, app, or in store.
More →- Journey mapping & touchpoint audit
- Onboarding flow optimization
- Lifecycle moment diagnosis
Voice of Customer & Feedback Orchestration
24+ solutionsCapture structured and unstructured signal at scale and turn it into a single, prioritized view of the customer.
Run standardized loyalty and satisfaction tracking that benchmarks over time.
More →Trigger the right question at the right moment across the journey.
More →Mine free-text feedback for themes no multiple-choice would surface.
More →Fold public signal from reviews and social into the same truth.
More →Route detractors to humans who can recover the relationship fast.
More →- NPS & CSAT program design
- Post-interaction survey orchestration
- Open-text theme analysis
Service Operations & Customer Support
18+ solutionsMeasure and improve the support experience so resolutions are fast, effortless, and rebuild trust.
Walk real support paths to find where customers get stuck or give up.
More →Measure whether issues are solved the first time, not the fifth.
More →Validate that agent guidance and scripts actually help resolve.
More →Test help centers and bots so customers solve it themselves.
More →Design the apology-and-fix moment that rebuilds loyalty.
More →- First Contact Resolution study
- Support journey usability test
- Knowledge-base comprehension test
Customer Retention, Loyalty & CLV
14+ solutionsFind the leading indicators of churn and loyalty, then act before the revenue walks out the door.
Separate the symptoms from the root causes of attrition.
More →Test whether rewards actually change behavior or just discount.
More →Learn from leavers to design a comeback that works.
More →Match the next offer to proven need, not a quota.
More →Connect experience improvements to CLV, not vanity metrics.
More →- Churn driver analysis
- Loyalty program evaluation
- Win-back interview program
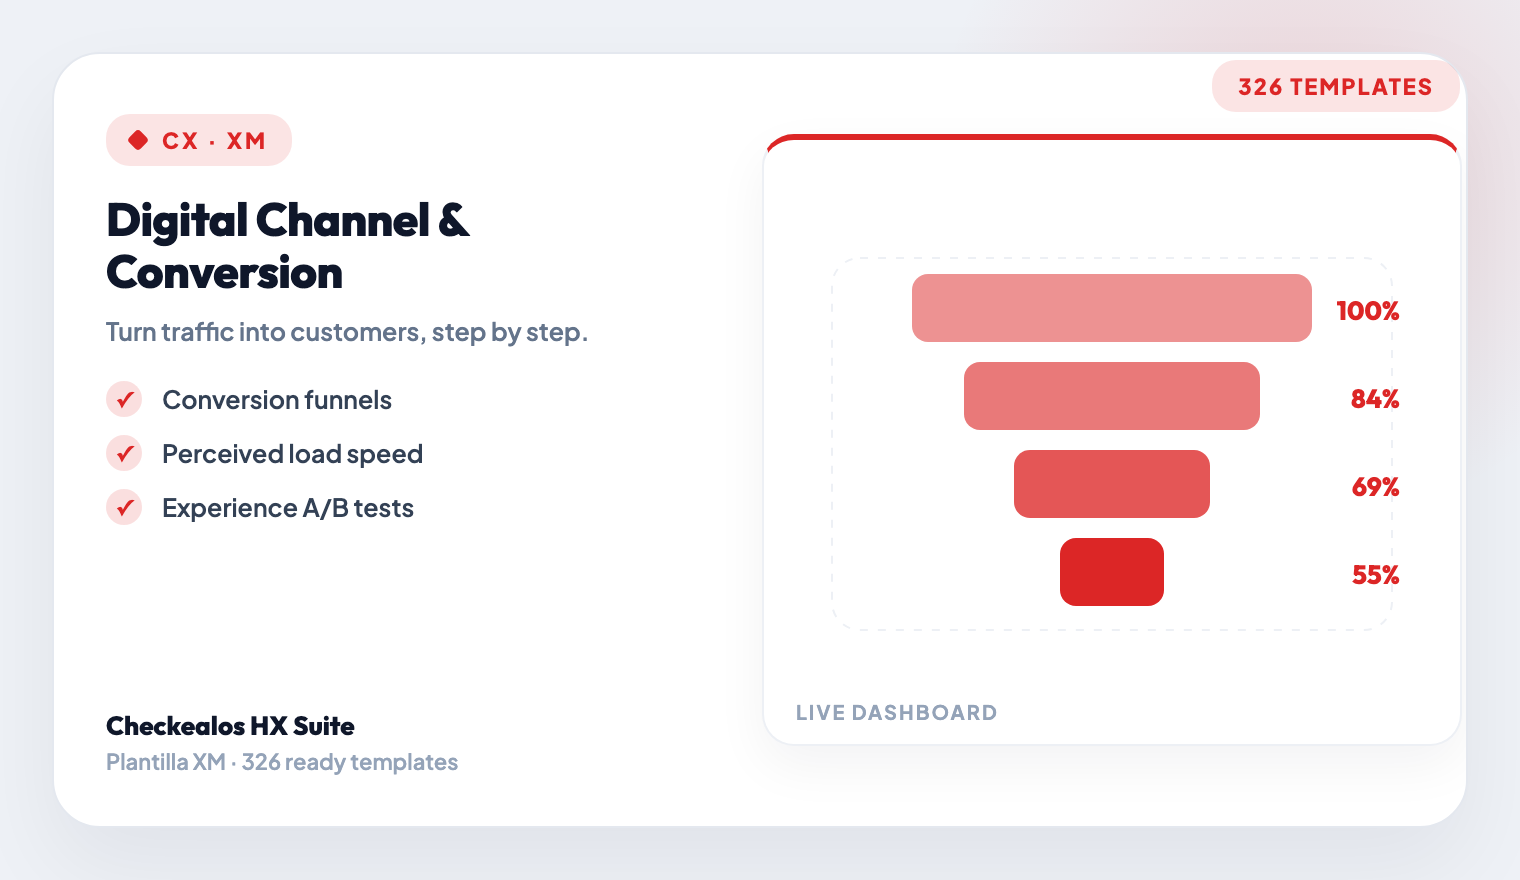
Digital Channel & Conversion Optimization
16+ solutionsOptimize websites, apps, and e-commerce flows so more customers complete the journey they came for.
Find the exact step where intent converts or collapses.
More →Verify paid and organic entry points route attention correctly.
More →Test the physical and digital blend customers actually traverse.
More →Check that tailored experiences feel helpful, not intrusive.
More →Ensure the channel works for every customer, not the average one.
More →- Funnel & checkout usability test
- Landing page first-click test
- Planogram & in-location test
Customer Insights & Behavioral Analytics
12+ solutionsTurn behavioral data and research into the customer truth that strategy and pricing decisions are built on.
Reveal what customers will actually pay before you set the price.
More →Understand the jobs different segments hire you to do.
More →Test new propositions with customers before roadmap commitment.
More →Link experience signals to downstream revenue and churn.
More →Push findings to the teams who can act, in the tools they use.
More →- Pricing & willingness-to-pay study
- Segment needs research
- Concept validation with customers
Checkealos CX vs. Traditional Approaches
Built for every team
Direct, plain-dealing value for the people who own the experience.
Product Design & UX
Ship with confidence — validate every product decision with real user data, before a line of code is written.
On this page you’ll find
- Rapid prototype validation with real users (think-aloud, task success, video proof)
- Feature prioritization backed by evidence, not opinion
- Conversion funnel diagnostics that find drop-off and the why
- Usability & competitive benchmarking across your product set
Marketing & CX
Stop guessing. Optimize campaigns and customer journeys with empirical data your CFO will respect.
On this page you’ll find
- NPS & CSAT programs with real-time detractor alerts
- Campaign & creative pre-testing before media spend
- Customer journey mapping with revenue impact per stage
- Marketing ROI & attribution tied to experience metrics
Executive & HR
One source of truth across CX and EX — lead with experience data, report to the board with a single number.
On this page you’ll find
- eNPS & engagement pulses with benchmark comparison
- 360° feedback and performance development at scale
- Onboarding & lifecycle experience with attrition prediction
- Executive dashboards linking people metrics to business outcomes
Engineering
Build the right thing, build it right — from usability evidence to performance perception.
On this page you’ll find
- Usability evidence that shows exactly where users struggle
- Perceived performance testing across devices and connections
- Developer experience (DX) for your own APIs and docs
- Accessibility validation with real assistive-tech users
Customer Support
Turn every support interaction into a loyalty moment. Measure and reduce customer effort.
On this page you’ll find
- CES tracking & benchmarking after every interaction
- Self-service content auditing with real tasks
- Agent quality & coaching from real interaction data
- Root-cause analysis linking tickets to product issues
Sales
Close more deals with customer intelligence — from discovery to proposal.
On this page you’ll find
- Competitive intelligence with third-party UX comparisons
- Value-proposition validation with real prospects
- Customer proof & case studies from satisfied users
- Win/loss analysis that feeds product and marketing
IT & Digital Ops
Build technology people can actually use — from internal tools to customer platforms.
On this page you’ll find
- Internal tool usability testing that lifts productivity
- Self-service platform optimization with task-based testing
- Technology adoption & change management before rollout
- System integration experience across handoffs
Board
Govern experience as a strategic asset. Make data-driven boardroom decisions.
On this page you’ll find
- Experience governance framework across all six dimensions
- Quarterly XM board reports tied to business outcomes
- Experience risk monitoring with early-warning indicators
- XM investment oversight with measurable returns
Comms & PR
Shape the narrative with audience intelligence — from messaging to crisis response.
On this page you’ll find
- Message testing & validation before you send
- Crisis-communication readiness under simulated pressure
- Media & stakeholder sentiment tracking
- Internal communications effectiveness for trust
Finance
Quantify the ROI of experience investments. Connect XM directly to the P&L.
On this page you’ll find
- XM ROI modeling linking NPS/CSAT to revenue
- Churn revenue-impact analysis and retention ROI
- Experience-linked forecasting for FP&A
- Board-ready business cases for XM investment
Innovation & R&D
De-risk innovation with real user validation — from concept to market.
On this page you’ll find
- Concept validation & screening before development
- Stage-gate experience validation at every phase
- Market-readiness assessment for near-complete products
- Trend & foresight research across all six dimensions
Rely on a panel of real testers
More than 120,000 validated testers across more than 70 countries for your usability studies, interviews and product tests. Recruitment, consent and deliverables in days.
"We went from three disconnected tools to a single Human Experience First. Customer and employee signal finally talk to each other, and our time-to-action went from weeks to days."
Experience without borders
We deliver measurable value across the globe through the industries with the greatest human impact.
 Financial & Banking
73% of banking interactions are now digital, yet 68% of customers would switch after one bad experience. We measure the full financial journey — from account opening to lending and wealth — so every touchpoint earns trust.
Explore Financial & Banking →Financial & Banking
What we measure
- Digital Account Opening & Onboarding — kill KYC friction behind 40-60% abandonment
- Mobile & Digital Banking Experience — lift app satisfaction and feature adoption
- Lending & Credit Experience — the highest-value journey, made effortless
- Trust, Security & Compliance UX — protection that feels safe, not hostile
 Retail & E-commerce
Cart abandonment averages 70% worldwide — over $4.6T lost every year. We optimize discovery, checkout, delivery and loyalty so browsers become buyers and buyers become advocates.
Explore Retail & E-commerce →Retail & E-commerce
What we measure
- Cart & Checkout Optimization — recover the revenue leaking at payment
- Product Discovery & Search — help shoppers find what they came for
- Post-Purchase & Loyalty Loop — turn delivery and returns into repeat purchase
- Omnichannel Consistency — one experience from app to store to call center
 Telecommunications
Operators lose 20-35% of subscribers every year. We predict churn, optimize digital journeys and shift support to self-service — cutting churn 15-25% and lifting NPS.
Explore Telecommunications →Telecommunications
What we measure
- Digital Subscriber Journey — from sign-up to renewal, measured end to end
- Churn Analysis & Retention — surface at-risk customers before they leave
- Self-Service & Support Optimization — deflect calls, resolve faster
- Billing Experience & Transparency — turn disputes into trust
 Insurance
68% of policyholders would switch after one bad claims experience. We turn quotes and claims into moments of trust — not friction — and keep them renewing year after year.
Explore Insurance →Insurance
What we measure
- Policy Quote & Purchase — cut the 50-70% quote abandonment gap
- Claims Journey Experience — the moment of truth, handled with care
- Digital Portal & Self-Service — give members control, not confusion
- Agent & Broker Experience — equip the people who sell and service
 Healthcare & Wellness
60% of patients would switch after a poor digital experience. We humanize booking, telemedicine and discharge so care starts with clarity — for patients and the frontline alike.
Explore Healthcare & Wellness →Healthcare & Wellness
What we measure
- Digital Patient Journey — from booking to follow-up, without the maze
- Discharge & Care Communication — instructions people actually understand
- Telemedicine Experience — usability that earns adoption and outcomes
- Clinician & Staff Experience — lighten the load that drives burnout
 Travel & Hospitality
57% of travelers find booking more stressful than the trip itself. We measure every moment — from search to baggage claim — to build loyalty, not anxiety.
Explore Travel & Hospitality →Travel & Hospitality
What we measure
- Booking & Search Optimization — make the path to ‘confirmed’ effortless
- Pre-Arrival & Check-In — set the tone before they arrive
- On-Property Guest Journey — every touchpoint, measured and improved
- Post-Stay & Loyalty — turn a good stay into the next booking
Six dimensions, one experience OS
UX is one of six XM dimensions. Explore how they connect — every program compounds when experience data flows across the enterprise.

UX covers usability testing, prototype validation, information architecture, digital analytics, and product-market fit. Companies with strong UX see 40% higher adoption, 50% fewer post-launch fixes, and 35% higher digital engagement.
Problems It Solves
- Products launched without user validation, leading to costly redesigns
- High drop-off rates in critical funnels (checkout, onboarding, activation)
- Fragmented digital analytics across web, mobile, and API surfaces
- No systematic way to benchmark product experience against competitors
- Post-launch analytics reveal problems too late to fix efficiently
- Disconnection between design decisions and actual user behavior data
Checkealos Solutions
- Usability testing with Think Aloud methodology and screen+face recording
- Prototype testing with Figma or Sketch files you upload, before development
- SUS/SUPRQ standardized usability benchmarking against industry scores
- Cross-platform journey analytics connecting all digital touchpoints
- First-Click, Tree Testing, and Card Sorting for IA validation
- A/B testing frameworks with statistical significance tracking
CX maps the complete journey from discovery to loyalty. Enterprises that master CX reduce churn by 25% and increase CLV by 40%.
Problems It Solves
- Fragmented customer feedback across channels (web, app, call center, stores)
- No visibility into post-purchase satisfaction or churn signals
- Inconsistent service quality across departments
- Reactive issue resolution instead of proactive journey optimization
- Lack of correlation between CX investments and revenue impact
Checkealos Solutions
- Voice of Customer (VoC) programs with multi-channel survey orchestration
- Real-time NPS & CSAT dashboards with automated alert escalation
- Transactional feedback at every journey stage (onboarding, purchase, support, renewal)
- Customer journey analytics with AI-powered friction detection
- Closed-loop feedback workflows linking frontline to strategy
BX tracks brand equity, ad recall, and sentiment across markets. Strong BX brands command 13% price premium and 2x customer loyalty.
Problems It Solves
- Brand perception disconnected from actual customer experience
- No measurement of ad effectiveness or campaign recall before launch
- Inconsistent brand messaging across channels and markets
- Difficulty quantifying brand equity vs. competitors in real-time
- Reputation crises detected too late to respond effectively
Checkealos Solutions
- Brand tracking studies with quarterly equity and awareness benchmarks
- Ad pre-testing and copy validation before media spend commitment
- Sentiment analysis across social, reviews, and open-text feedback
- Blind brand studies to eliminate bias in competitive positioning
- Brand health dashboards with automated reputation monitoring
SX measures service quality across support channels (phone, chat, email, self-service). Strong SX reduces support costs by 30% while increasing satisfaction.
Problems It Solves
- Long wait times and high call center volumes with no root-cause analysis
- Self-service portals with low adoption and high abandonment rates
- Inconsistent service quality across agents and channels
- No visibility into customer effort during support interactions
- Chatbot and AI support deployed without quality measurement
Checkealos Solutions
- CES (Customer Effort Score) tracking at every support touchpoint
- Help Center and FAQ usability testing with task completion analytics
- Chatbot conversation audits with AI-powered quality scoring
- Agent performance dashboards with customer satisfaction correlation
- Channel optimization studies comparing phone, chat, email, and self-service

HX measures the human journey from hiring to alumni. Companies with strong HX see 21% higher profitability and 41% lower absenteeism.
Problems It Solves
- High voluntary attrition with no root-cause visibility
- Onboarding takes 6+ months to reach full productivity
- Low engagement scores with no actionable improvement plan
- Disconnected feedback loops between HR and business units
- Difficulty measuring impact of culture initiatives on business outcomes
Checkealos Solutions
- eNPS lifecycle surveys (onboarding, quarterly pulse, exit, alumni)
- 360-degree feedback programs with manager action plans
- Onboarding journey diagnostics with time-to-productivity tracking
- Culture health dashboards with team-level benchmarks
- AI-powered sentiment analysis on open-text people feedback
StX connects the six dimensions to corporate strategy. Organizations with strong strategic experience align every experience investment to measurable business outcomes.
Problems It Solves
- Strategic decisions made on anecdotes instead of measured experience data
- New ventures and product innovations launched without market validation
- No board-level view of experience as a strategic asset
- Learning and training programs with no measurable experience impact
- Pricing and packaging decisions not tested against customer psychology
Checkealos Solutions
- Strategic foresight and market-sensing studies across all six dimensions
- Innovation and new-venture validation with concept and idea testing
- Executive experience-governance dashboards with cross-dimensional KPIs
- Learning and education experience measurement for training programs
- Pricing and decision-psychology research to optimize offers and bundling
Ready to understand your customers?
85 solutions, 6 methodologies, 1M+ participants. Start your first CX study in minutes.
Request a demo