
Executive & HR Teams
Executive and HR leaders need a unified view of experience across the entire organization from customer loyalty to employee engagement to brand perception. Checkealos gives CHROs, CPOs, CEOs, and HR teams the tools to measure what matters, predict what is coming, and demonstrate the business impact of people investments. Every metric connects to a business outcome, every dashboard tells a strategic story.
How Checkealos Serves Executive & HR Teams
Built for the way your team actually works — evidence at every step, in hours instead of weeks.
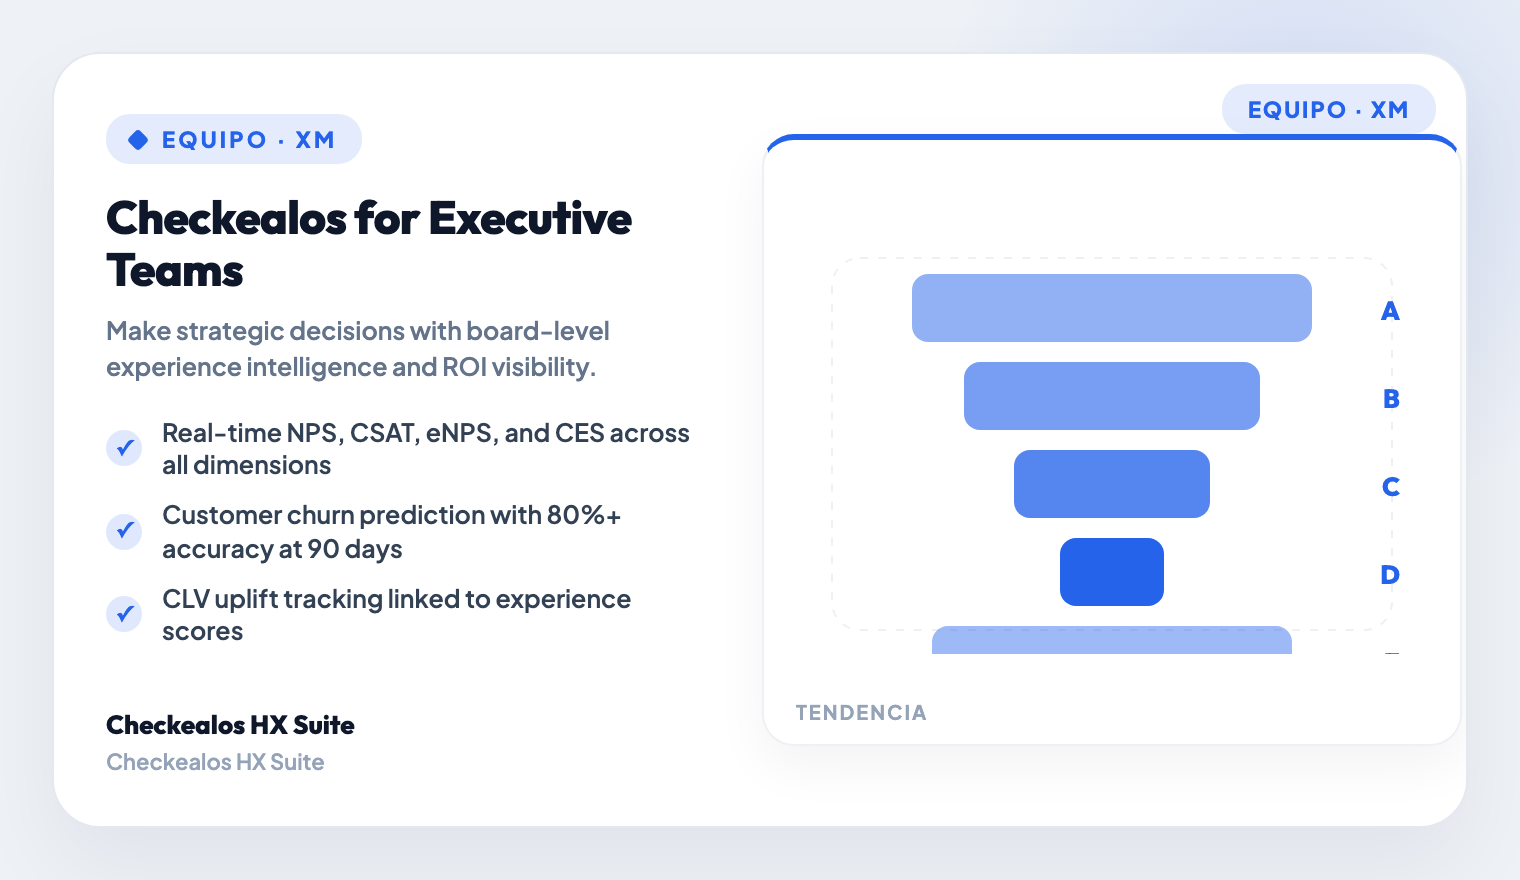
eNPS & Employee Engagement
Deploy Employee Net Promoter Score and pulse engagement surveys across the organization. Measure engagement, belonging, wellbeing, and organizational commitment by team, location, and tenure.
Deploy Employee Net Promoter Score and pulse surveys across the organization.
Measure engagement, belonging, and wellbeing by team, location, and tenure.
Compare against industry benchmarks with automated anonymity protection.
360° Feedback & Performance Development
Multi-rater feedback programs at organizational scale. Anonymous peer, manager, and self-assessment with configurable competency models.
Run multi-rater feedback programs with anonymous peer, manager, and self-assessment.
Configure competency models and automated gap analysis.
Deliver individual and team-level reports with action planning frameworks.
Onboarding & Lifecycle Experience
Track the complete employee journey from offer acceptance through onboarding, development, internal moves, and alumni. Day 7/30/90 pulse checks with time-to-productivity measurement.
Track the employee journey from offer through onboarding, development, and alumni.
Run Day 7/30/90 pulse checks with time-to-productivity measurement.
Analyze exit interviews with predictive attrition modeling.
Culture & Change Management
Measure organizational culture, psychological safety, and change readiness. Pulse surveys track sentiment through mergers, restructures, and transformations.
Measure organizational culture, psychological safety, and change readiness.
Track sentiment through mergers, restructures, and transformations.
Benchmark culture health against peers and generate team-level action plans.
Executive Experience Dashboards
Unified cross-dimensional view of experience metrics for C-suite and board reporting. Connect employee experience to business outcomes productivity, retention, revenue per employee.
Provide a unified cross-dimensional view of experience metrics for C-suite and board.
Connect employee experience to productivity, retention, and revenue per employee.
Deliver quarterly board-ready experience governance reports.
Employer Brand & Candidate Experience
Measure candidate experience from job discovery through application, interview, offer, and onboarding. Track employer brand perception on review platforms and social media.
Measure candidate experience from discovery through application, interview, and offer.
Track employer brand perception on review platforms and social media.
Correlate candidate NPS to acceptance rates and time-to-hire.
Key Metrics for Executive & HR Teams
Rely on a panel of real testers
More than 120.000 validated testers across more than 70 countries for your usability studies, interviews and product tests. Recruitment, consent and deliverables in days.
Six dimensions, one experience OS
Every program runs across the six XM dimensions. Explore how they connect — experience data compounds when it flows across the enterprise.

UX covers usability testing, prototype validation, information architecture, digital analytics, and product-market fit. Companies with strong UX see 40% higher adoption, 50% fewer post-launch fixes, and 35% higher digital engagement.
Problems It Solves
- Products launched without user validation, leading to costly redesigns
- High drop-off rates in critical funnels (checkout, onboarding, activation)
- Fragmented digital analytics across web, mobile, and API surfaces
- No systematic way to benchmark product experience against competitors
- Post-launch analytics reveal problems too late to fix efficiently
- Disconnection between design decisions and actual user behavior data
Checkealos Solutions
- Usability testing with Think Aloud methodology and screen+face recording
- Prototype testing with Figma or Sketch files you upload, before development
- SUS/SUPRQ standardized usability benchmarking against industry scores
- Cross-platform journey analytics connecting all digital touchpoints
- First-Click, Tree Testing, and Card Sorting for IA validation
- A/B testing frameworks with statistical significance tracking
CX maps the complete journey from discovery to loyalty. Enterprises that master CX reduce churn by 25% and increase CLV by 40%.
Problems It Solves
- Fragmented customer feedback across channels (web, app, call center, stores)
- No visibility into post-purchase satisfaction or churn signals
- Inconsistent service quality across departments
- Reactive issue resolution instead of proactive journey optimization
- Lack of correlation between CX investments and revenue impact
Checkealos Solutions
- Voice of Customer (VoC) programs with multi-channel survey orchestration
- Real-time NPS & CSAT dashboards with automated alert escalation
- Transactional feedback at every journey stage (onboarding, purchase, support, renewal)
- Customer journey analytics with AI-powered friction detection
- Closed-loop feedback workflows linking frontline to strategy
BX tracks brand equity, ad recall, and sentiment across markets. Strong BX brands command 13% price premium and 2x customer loyalty.
Problems It Solves
- Brand perception disconnected from actual customer experience
- No measurement of ad effectiveness or campaign recall before launch
- Inconsistent brand messaging across channels and markets
- Difficulty quantifying brand equity vs. competitors in real-time
- Reputation crises detected too late to respond effectively
Checkealos Solutions
- Brand tracking studies with quarterly equity and awareness benchmarks
- Ad pre-testing and copy validation before media spend commitment
- Sentiment analysis across social, reviews, and open-text feedback
- Blind brand studies to eliminate bias in competitive positioning
- Brand health dashboards with automated reputation monitoring
SX measures service quality across support channels (phone, chat, email, self-service). Strong SX reduces support costs by 30% while increasing satisfaction.
Problems It Solves
- Long wait times and high call center volumes with no root-cause analysis
- Self-service portals with low adoption and high abandonment rates
- Inconsistent service quality across agents and channels
- No visibility into customer effort during support interactions
- Chatbot and AI support deployed without quality measurement
Checkealos Solutions
- CES (Customer Effort Score) tracking at every support touchpoint
- Help Center and FAQ usability testing with task completion analytics
- Chatbot conversation audits with AI-powered quality scoring
- Agent performance dashboards with customer satisfaction correlation
- Channel optimization studies comparing phone, chat, email, and self-service
HX measures the human journey from hiring to alumni. Companies with strong HX see 21% higher profitability and 41% lower absenteeism.
Problems It Solves
- High voluntary attrition with no root-cause visibility
- Onboarding takes 6+ months to reach full productivity
- Low engagement scores with no actionable improvement plan
- Disconnected feedback loops between HR and business units
- Difficulty measuring impact of culture initiatives on business outcomes
Checkealos Solutions
- eNPS lifecycle surveys (onboarding, quarterly pulse, exit, alumni)
- 360-degree feedback programs with manager action plans
- Onboarding journey diagnostics with time-to-productivity tracking
- Culture health dashboards with team-level benchmarks
- AI-powered sentiment analysis on open-text people feedback
StX connects the six dimensions to corporate strategy. Organizations with strong strategic experience align every experience investment to measurable business outcomes.
Problems It Solves
- Strategic decisions made on anecdotes instead of measured experience data
- New ventures and product innovations launched without market validation
- No board-level view of experience as a strategic asset
- Learning and training programs with no measurable experience impact
- Pricing and packaging decisions not tested against customer psychology
Checkealos Solutions
- Strategic foresight and market-sensing studies across all six dimensions
- Innovation and new-venture validation with concept and idea testing
- Executive experience-governance dashboards with cross-dimensional KPIs
- Learning and education experience measurement for training programs
- Pricing and decision-psychology research to optimize offers and bundling
Ready to lead with experience data?
eNPS programs, 360° feedback, executive dashboards. Start connecting people experience to business outcomes today.
Request a Demo