
Retail & E-commerce
E-commerce cart abandonment averages 70% globally. That represents 4.6 trillion dollars in lost revenue every year revenue that was almost captured, then lost at the final steps. Every moment of the purchase journey, from product discovery and search through checkout, payment, delivery tracking, unboxing, and returns, is a decision point where experience determines whether a browser becomes a buyer, a one-time purchaser, or a loyal repeat customer.
Checkealos gives retailers and e-commerce teams a complete experience measurement toolkit spanning the entire customer lifecycle. Product discovery and search usability tested with real shoppers. Cart and checkout flows optimized with video evidence of abandonment moments. Post-purchase experience measured from delivery through returns. Omnichannel consistency validated across web, mobile app, and physical stores. Brand perception tracked to understand why customers choose you or your competitor.
Retailers using systematic experience measurement achieve 15-27% improvement in conversion rates, 30-50% reduction in cart abandonment, and measurable increases in average order value, repeat purchase rate, and customer lifetime value typically within the first operating quarter.
Retail Industry Challenges
70% cart abandonment shoppers leave at the final steps due to hidden costs, forced registration, or confusing payment flows
Product discovery fails when search, filtering, and category navigation do not match real shopping behavior
Returns experience damages repeat purchase intent complicated processes create negative post-purchase memory
Mobile traffic dominates at 60%+ of visits, yet mobile conversion lags 30-50% behind desktop the gap is pure UX friction
Omnichannel inconsistency pricing, inventory, and policies that differ between online, app, and store erode trust
Seasonal peaks like Black Friday expose brittle experiences 48 hours of extreme traffic reveals every UX weakness at once
How Checkealos Solves Retail Challenges
Four complementary solutions spanning the full customer lifecycle — from first contact through retention.
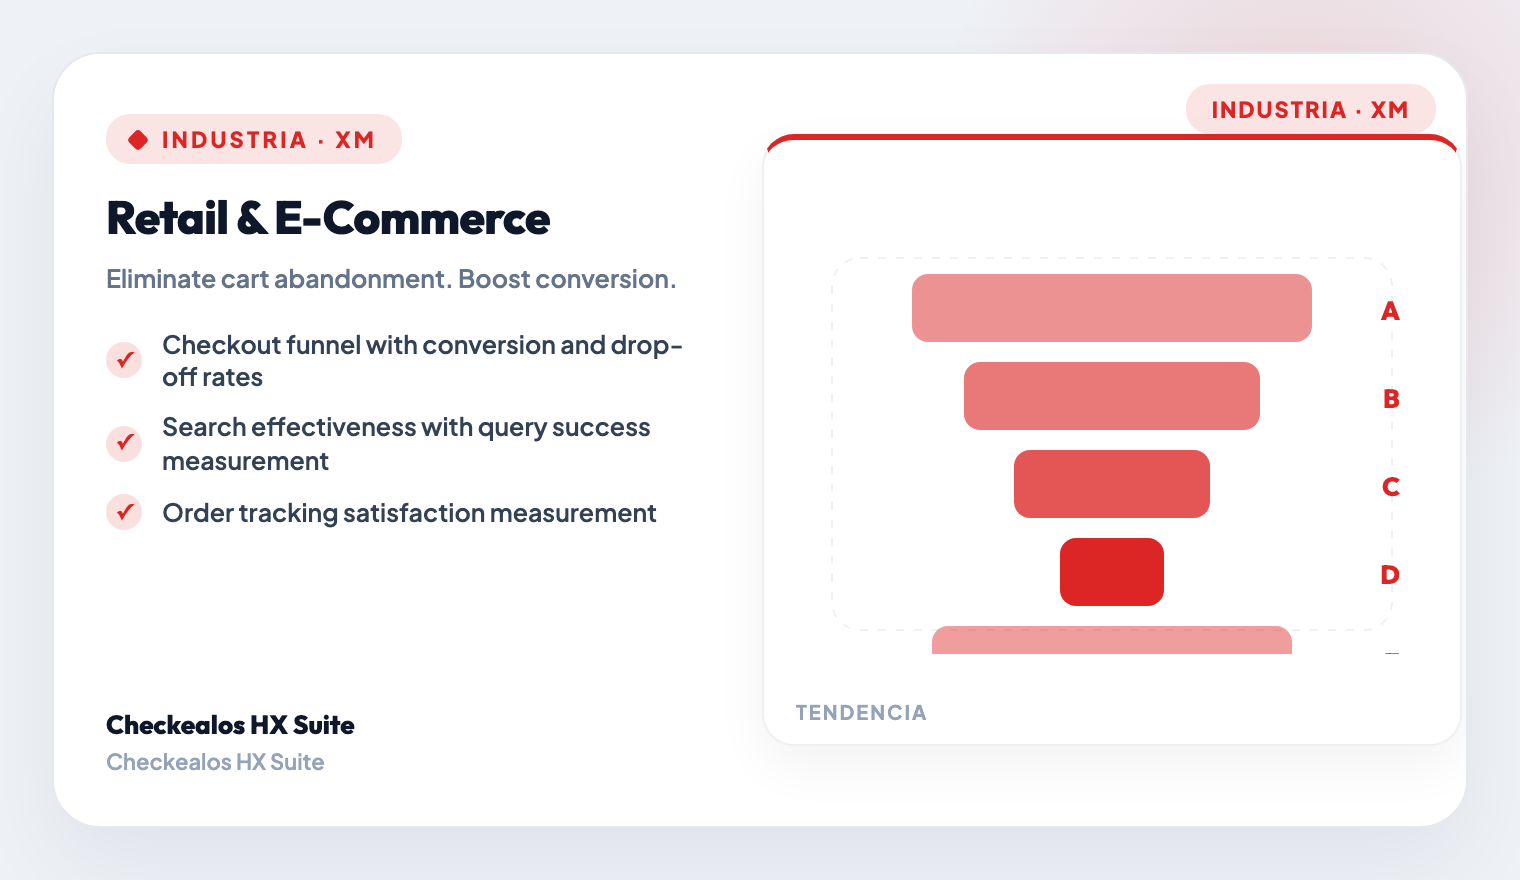
Cart & Checkout Optimization
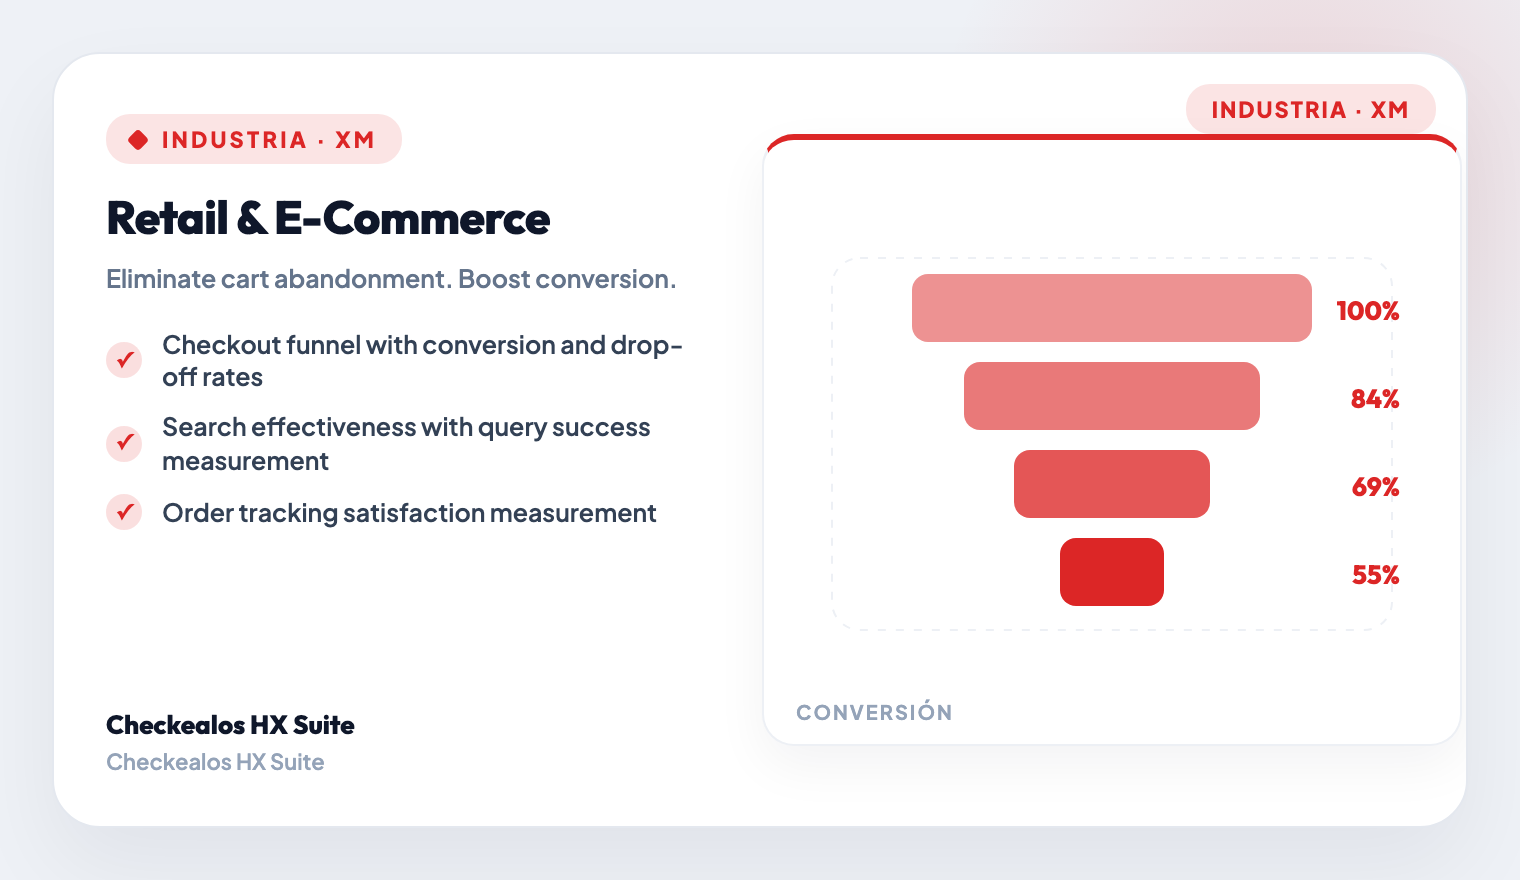
UX driven highest ROIThe final steps of the purchase journey determine whether 70% of potential revenue is captured. Test cart review, shipping options, payment methods, promo code application, and order confirmation with real shoppers. Video recordings capture the exact moment and reason for abandonment.
Step-by-step funnel analysis with abandonment point identification and video evidence of exactly where and why shoppers leave.
Compare guest vs account checkout, single-page vs multi-step, and payment method ordering for conversion impact.
Test shipping option presentation, delivery timeline clarity, and free-shipping threshold communication.
Measure Apple Pay, Google Pay, and Shop Pay integration flows with device-specific usability testing.
Product Discovery & Search
UX + IACustomers who find what they want buy it. Customers who cannot find it leave often to a competitor. Test search relevance, filtering, faceted navigation, category structures, product detail pages, and recommendation engines with real shoppers performing real shopping tasks.
Test search results accuracy with real product catalogs and natural shopping queries across shopper segments.
Validate category navigation structure and findability through open, closed, and hybrid card sorting methods.
Evaluate filter interaction patterns, applied filter visibility, and clear-all functionality across devices.
Measure product detail page trust, purchase intent, and information findability for key shopper questions.
Post-Purchase & Loyalty Loop
CX + SXThe experience after purchase determines whether a customer returns. Test delivery tracking communications, unboxing experience, returns and exchange processes, and loyalty program interactions. NPS deployed at Day 1, Day 7, Day 30, and Day 90 post-purchase reveals the complete loyalty picture.
Test delivery notification clarity across email, SMS, and in-app channels with real customer expectations.
Evaluate returns label generation, drop-off location finder, and refund timeline communication with real customers.
Deploy satisfaction surveys at delivery, 7 days, and 30 days to capture the complete loyalty picture.
Measure enrollment friction, redemption ease, and reward relevance across loyalty program tiers.
Omnichannel Experience Consistency
UX + CX + BX combinedCustomers expect a seamless experience across every channel web, mobile app, physical store, social commerce, marketplace. Test cross-channel consistency in pricing, inventory visibility, fulfillment options, and returns policies. Identify the gaps where channel switching creates friction and erodes brand trust.
Map online-to-in-store journeys including BOPIS and BORIS flows with real customer task completion.
Test whether website stock information matches store reality and how discrepancies affect trust.
Validate pricing, promotions, and loyalty reward presentation across all channels and platforms.
Compare web, app, and physical retail touchpoints for brand experience and satisfaction consistency.
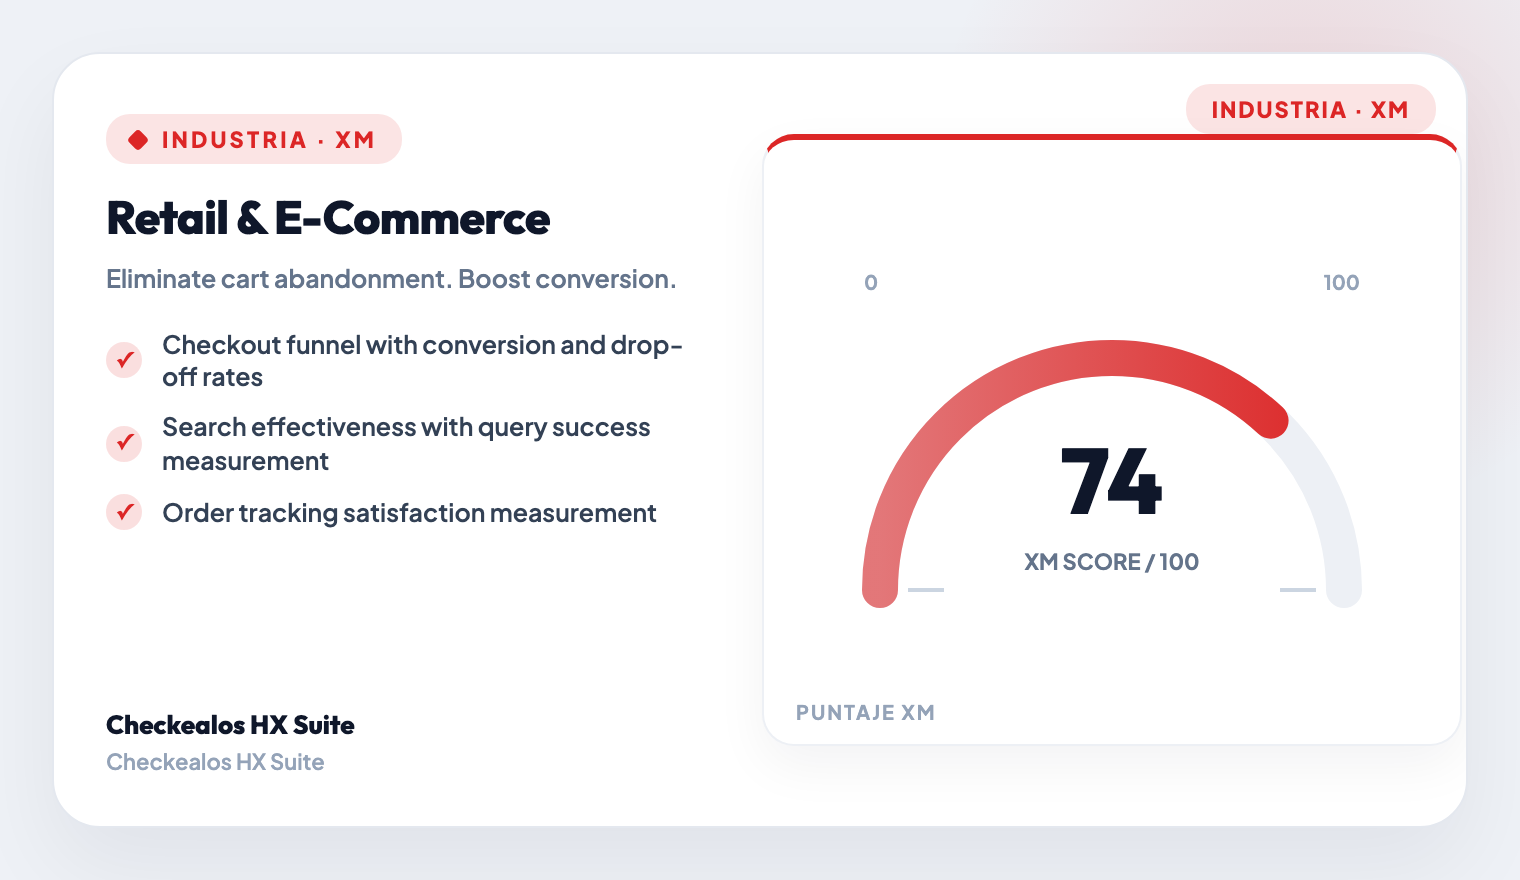
How Retail XM Programs Work
Key Retail Experience Metrics
The profiles involved
Direct, plain-dealing value for the people who own the experience.
Chief Experience Officer
Benchmark experience maturity across the six dimensions and tie it directly to business outcomes.
On this page you’ll find
- See every dimension in one real-time executive dashboard
- Benchmark maturity versus industry and competitors
- Connect experience investments to revenue and retention
- Report to the board with a single, defensible number
Head of Customer Experience
Own the end-to-end journey from first contact through renewal with evidence at every touchpoint.
On this page you’ll find
- Deploy NPS and CSAT at every lifecycle milestone
- Track CES per channel and interaction type
- Close the loop with automated detractor workflows
- Predict churn before the contract ends
Digital Product Manager
Prioritize the digital roadmap around validated friction, not internal opinion.
On this page you’ll find
- Validate key journeys before a sprint is committed
- Prioritize the backlog with task-success and drop-off data
- A/B test offers, pricing and upgrade flows
- Turn research into a roadmap the board understands
UX Researcher
Run moderated and unmoderated studies at scale with a ready panel and standardized metrics.
On this page you’ll find
- Launch studies in minutes from enriched templates
- Recruit from a panel of 120.000+ testers in more than 70 countries
- Standardize metrics across every study (SUS, SEQ, CES)
- Synthesize findings with auto-generated insight reports
Customer Support Lead
Cut contact volume by fixing the upstream journeys that generate avoidable tickets.
On this page you’ll find
- Audit IVR, chatbot and FAQ content with real users
- Measure CES by channel, issue type and agent team
- Track First Contact Resolution with root-cause analysis
- Link support tickets back to product issues
Marketing & Growth
Validate offers, pricing and campaigns with real audience signal before you spend.
On this page you’ll find
- Pre-test campaigns and creative before media spend
- Validate pricing and packaging with real purchase psychology
- Measure landing-page relevance and first-click clarity
- Tie acquisition experiments to downstream retention
Rely on a panel of real testers
More than 120.000 validated testers across more than 70 countries for your usability studies, interviews and product tests. Recruitment, consent and deliverables in days.
Six dimensions, one experience OS
Every program runs across the six XM dimensions. Explore how they connect — experience data compounds when it flows across the enterprise.

UX covers usability testing, prototype validation, information architecture, digital analytics, and product-market fit. Companies with strong UX see 40% higher adoption, 50% fewer post-launch fixes, and 35% higher digital engagement.
Problems It Solves
- Products launched without user validation, leading to costly redesigns
- High drop-off rates in critical funnels (checkout, onboarding, activation)
- Fragmented digital analytics across web, mobile, and API surfaces
- No systematic way to benchmark product experience against competitors
- Post-launch analytics reveal problems too late to fix efficiently
- Disconnection between design decisions and actual user behavior data
Checkealos Solutions
- Usability testing with Think Aloud methodology and screen+face recording
- Prototype testing with Figma or Sketch files you upload, before development
- SUS/SUPRQ standardized usability benchmarking against industry scores
- Cross-platform journey analytics connecting all digital touchpoints
- First-Click, Tree Testing, and Card Sorting for IA validation
- A/B testing frameworks with statistical significance tracking
CX maps the complete journey from discovery to loyalty. Enterprises that master CX reduce churn by 25% and increase CLV by 40%.
Problems It Solves
- Fragmented customer feedback across channels (web, app, call center, stores)
- No visibility into post-purchase satisfaction or churn signals
- Inconsistent service quality across departments
- Reactive issue resolution instead of proactive journey optimization
- Lack of correlation between CX investments and revenue impact
Checkealos Solutions
- Voice of Customer (VoC) programs with multi-channel survey orchestration
- Real-time NPS & CSAT dashboards with automated alert escalation
- Transactional feedback at every journey stage (onboarding, purchase, support, renewal)
- Customer journey analytics with AI-powered friction detection
- Closed-loop feedback workflows linking frontline to strategy
BX tracks brand equity, ad recall, and sentiment across markets. Strong BX brands command 13% price premium and 2x customer loyalty.
Problems It Solves
- Brand perception disconnected from actual customer experience
- No measurement of ad effectiveness or campaign recall before launch
- Inconsistent brand messaging across channels and markets
- Difficulty quantifying brand equity vs. competitors in real-time
- Reputation crises detected too late to respond effectively
Checkealos Solutions
- Brand tracking studies with quarterly equity and awareness benchmarks
- Ad pre-testing and copy validation before media spend commitment
- Sentiment analysis across social, reviews, and open-text feedback
- Blind brand studies to eliminate bias in competitive positioning
- Brand health dashboards with automated reputation monitoring

SX measures service quality across support channels (phone, chat, email, self-service). Strong SX reduces support costs by 30% while increasing satisfaction.
Problems It Solves
- Long wait times and high call center volumes with no root-cause analysis
- Self-service portals with low adoption and high abandonment rates
- Inconsistent service quality across agents and channels
- No visibility into customer effort during support interactions
- Chatbot and AI support deployed without quality measurement
Checkealos Solutions
- CES (Customer Effort Score) tracking at every support touchpoint
- Help Center and FAQ usability testing with task completion analytics
- Chatbot conversation audits with AI-powered quality scoring
- Agent performance dashboards with customer satisfaction correlation
- Channel optimization studies comparing phone, chat, email, and self-service

HX measures the human journey from hiring to alumni. Companies with strong HX see 21% higher profitability and 41% lower absenteeism.
Problems It Solves
- High voluntary attrition with no root-cause visibility
- Onboarding takes 6+ months to reach full productivity
- Low engagement scores with no actionable improvement plan
- Disconnected feedback loops between HR and business units
- Difficulty measuring impact of culture initiatives on business outcomes
Checkealos Solutions
- eNPS lifecycle surveys (onboarding, quarterly pulse, exit, alumni)
- 360-degree feedback programs with manager action plans
- Onboarding journey diagnostics with time-to-productivity tracking
- Culture health dashboards with team-level benchmarks
- AI-powered sentiment analysis on open-text people feedback
StX connects the six dimensions to corporate strategy. Organizations with strong strategic experience align every experience investment to measurable business outcomes.
Problems It Solves
- Strategic decisions made on anecdotes instead of measured experience data
- New ventures and product innovations launched without market validation
- No board-level view of experience as a strategic asset
- Learning and training programs with no measurable experience impact
- Pricing and packaging decisions not tested against customer psychology
Checkealos Solutions
- Strategic foresight and market-sensing studies across all six dimensions
- Innovation and new-venture validation with concept and idea testing
- Executive experience-governance dashboards with cross-dimensional KPIs
- Learning and education experience measurement for training programs
- Pricing and decision-psychology research to optimize offers and bundling
Ready to convert more shoppers?
Proven retail templates, cart abandonment diagnostics, omnichannel journey mapping. Start optimizing every moment of the purchase journey today.
Request a Demo